

Imagine for a moment leaping head-first into a pool of complex multidimensional data, only to emerge with patterns, trends, and insights you hadn’t even known to look for. Welcome to the immersive, intuitive world of Embedding Visualization, a technique widely adopted in the realm of machine learning to visualize high-dimensional data. It may sound complicated, but don’t worry, we’re going to break it down into bite-size pieces.
First things first, what are ’embeddings’? Without getting too entangled in jargon, you can consider embeddings as a form of translation, where we convert high-dimensional data into 2D or 3D. This allows us to clearly visualize the ‘distance’ & ‘relationships’ between data points.
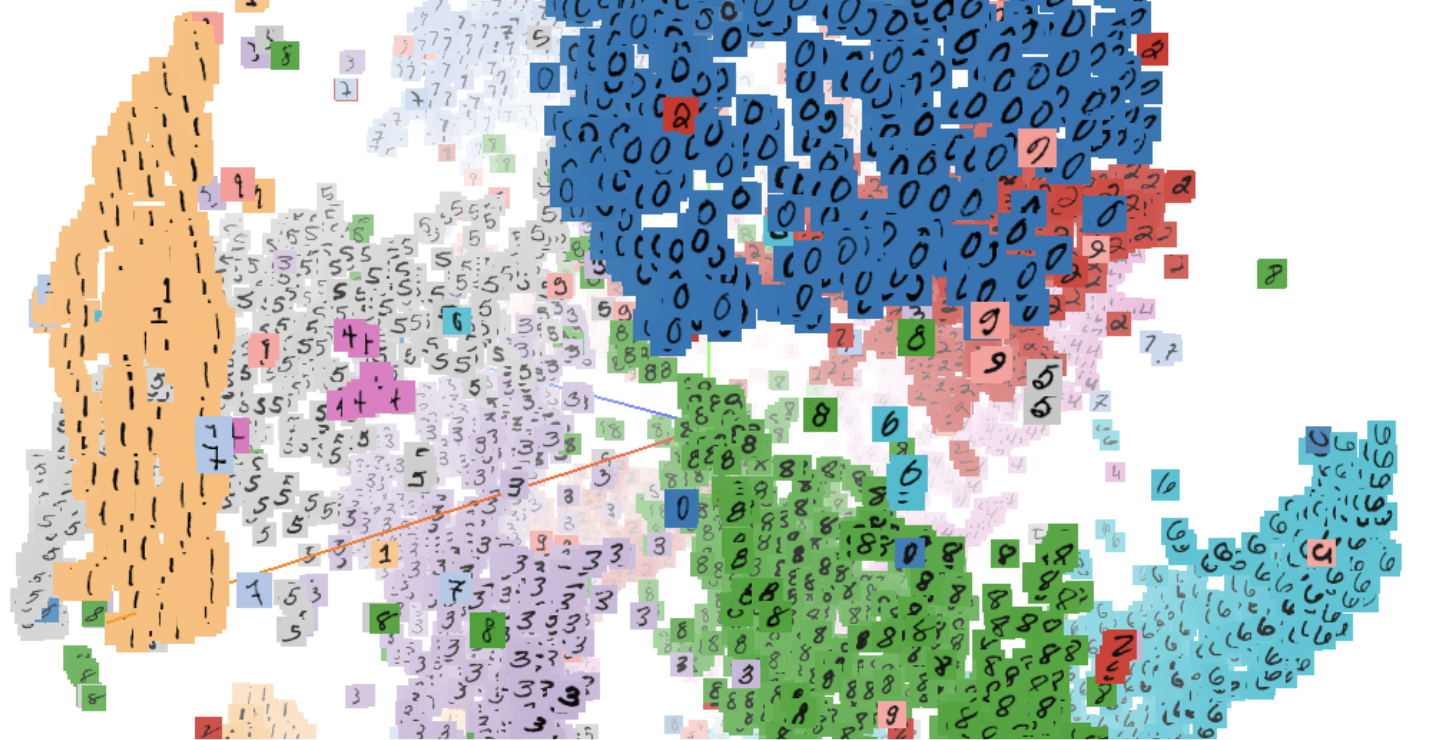
Transforming complex high-dimensional data into a visual format is no easy task. Major techniques like t-Distributed Stochastic Neighbor Embedding (t-SNE), Uniform Manifold Approximation, and Projection (UMAP), or Principal Component Analysis (PCA) are often summoned to the rescue. These algorithms navigate the delicate balance of maintaining data integrity while providing an interpretable visual representation.
Take the instance of t-SNE, a non-linear technique that embeds high dimensional data into low dimensional space. Using the idea of ‘neighborhoods’, t-SNE allows us to retain the structure of similar instances, demonstrating visually how machine learning algorithms ‘see’ & categorize data.
UMAP, on the other hand, creates a structured geometric representation instead of relying exclusively on proximity measures. More computationally efficient than t-SNE, UMAP can handle larger datasets & even outperform PCA in certain scenarios by preserving more global structure.
PCA is primarily used for reducing dimensionality in data while retaining those characteristics that contribute most to its variance. In the context of visualization, it’s like filtering the noise out & highlighting the ‘true’ structure of the data.
We know what you’re thinking: Sounds great, but how can Embedding Visualization work for me? Well, let’s take an example. You’re developing an AI module for a trading algorithm. Embedding visualization will serve as your secret weapon, intuitively setting off alarm bells if your data clusters are acting wildly different from historical trends.
Another exciting use-case can be found in Natural Language Processing (NLP). Let’s say you’re gearing up to create an advanced recommendation algorithm. By using techniques like Word2Vec to visualize word embeddings, you can more easily identify patterns and semantic relationships between words or documents.
In the design industry, it’s often claimed that ‘seeing is believing.’ When it comes to artificial intelligence, we believe in ‘visualizing to understand.’ Better visualization of your trained models ensures improved interpretability, trustworthiness, and ultimately better AI design.
Tools like TensorBoard or Embedding Projector allow technologists the liberty to explore multidimensional data in a 3D space, thereby doubling the success in pattern recognition or anomaly detection. What once was a convoluted slew of numbers can now essentially become your playground of insights.
Consider also the boon embedding visualization can be for those handling a multitude of AI projects. A visual representation of machine learning operations lets you track progress, evaluate results, and communicate effectively with team members & stakeholders alike.
Despite its numerous advantages, like all good things, embedding visualization comes with its challenges. The curse of dimensionality, overplotting, misrepresentation due to random initialization are some key areas technologists continue to work on improving.
Still, embedding visualization is continuously growing. Leveraging anything from color to shape & even interactivity, today’s visualization tools are more sophisticated than ever. With evolving technologies at the helm, the future of embedding visualization indeed looks promising.
To sum up, embedding visualization provides a bridge to understanding high dimensional data through reduced dimensions. Improving intuition, fostering trust, aiding communication, and increasing transparency, this tool lets us do more than just ‘see’ data – it allows us to explore, discover & understand.
Embedding Visualization is changing the contours of the AI landscape, transforming technologists into explorers of a brave new world. It encourages us all to dive deep experimentally, turn data on its head, and, when we emerge, to bring with us the rich treasure of insight, understanding, and shared knowledge.

